A dashboard nobody uses is just a screensaver. Plenty of companies invest in business intelligence, get a wall of charts, and still make decisions on gut feel because the reports don’t answer the questions people actually have. BI and analytics services are supposed to close the gap to take raw data and turn it into something that genuinely changes what people do. The difference between a BI project that works and one that gathers dust comes down to a few things worth understanding before you start.
BI and analytics aren’t the same thing
The terms get bundled together, but they describe different work, and knowing the difference helps you ask for the right thing.
Business intelligence is mostly about understanding what happened and what’s happening now. Sales by region, this month versus last, which products move and which don’t. It’s descriptive – reports and dashboards that give people a clear, current view of the business.
This is where most companies start, and for good reason: you can’t manage what you can’t see.
Advanced analytics goes further, into why things happen and what’s likely next. It’s predictive and diagnostic, forecasting demand, modeling churn, finding the hidden drivers behind a trend. It builds on the foundation BI provides.
Most businesses need solid BI before advanced analytics makes sense. Trying to forecast the future when you can’t reliably report the present is building the second floor before the first. A good provider will tell you that, even when the advanced work is the shinier sell.
What good BI and analytics services include
A complete offering covers the full path from raw data to decision:
- Data foundation. Integration and cleaning so reports draw from trustworthy, unified data. Skipping this is why so many dashboards show numbers people don’t believe.
- Reporting and dashboards. The visible layer with built in tools like Power BI or Tableau is designed around the questions people actually ask.
- Self-service capability. Letting business users explore data themselves instead of queuing every question behind an analyst.
- Advanced analytics. Forecasting and modeling for the decisions that justify it.
- Governance. Making sure everyone sees consistent, correct numbers and only the data they should.
The foundation matters more than the dashboards, even though the dashboards get the attention. A beautiful report built on messy data is worse than no report, because it gives false confidence. Teams that deliver BI and analytics services as an end-to-end practice handle the unglamorous data work underneath, which is exactly what makes the visible layer trustworthy.
Why dashboards go unused
BI underuse is the norm, not the exception – Gartner has found analytics adoption stuck below a third of employees at most organizations, and IBM points to the same low-adoption problem holding back the value companies expect from their dashboards. If BI so often disappoints, it’s worth knowing why. The failures share a handful of patterns:
- They answer the wrong questions. Dashboards built around what’s easy to measure rather than what people need to decide. The data is accurate and useless at the same time.
- Nobody trusts the numbers. When the underlying data is messy or contradicts what people see elsewhere, they stop believing the dashboard and go back to their spreadsheets.
- They’re too complicated. A report crammed with every possible metric overwhelms instead of informs. Good BI is ruthless about showing what matters and hiding the rest.
- They don’t fit the workflow. A dashboard people have to remember to open is a dashboard people forget. The best ones meet users where they already work.
The fix for all of these is starting from the decision, not the data. Ask what choices people make, what would help them make those choices better, and build backward from there.
Self-service: powerful and easy to get wrong
A big promise of modern BI is self-service, letting business users answer their own questions instead of waiting on an analyst. Done well, it frees analysts for harder work and gives everyone faster answers.
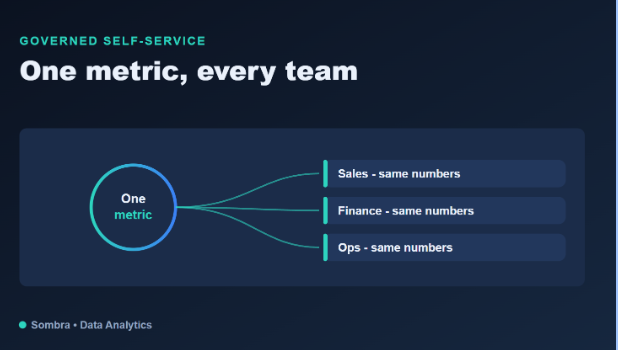
Done poorly, it creates chaos: everyone building their own slightly different version of a metric, until “revenue” means five things depending on who you ask. The safeguard is governance – defining key metrics once, centrally, so self-service explores trustworthy, consistent data rather than spawning conflicting definitions. Freedom on top of a governed foundation works. Freedom without it just multiplies the confusion.
Knowing it’s working
Judge BI and analytics by behavior, not output. The real signs of success:
- People actually use it. The dashboards are part of how decisions get made, not a thing built and forgotten.
- Decisions get faster. Questions that used to take days of digging get answered in minutes.
- Debates shrink. Teams stop arguing about whose numbers are right and start discussing what to do about them.
- Analysts do harder work. With routine questions handled by self-service, analysts move to the genuinely difficult problems.
If your reporting doesn’t move these needles, the issue usually isn’t the tool. It’s that the work started from the data instead of the decision.
Getting started the right way
If you’re building or rebuilding your BI and analytics capability, resist two temptations: don’t skip the data foundation to get to dashboards faster, and don’t leap to advanced analytics before basic reporting is solid and trusted.
Start by understanding the decisions your teams make and where better information would help. Build a clean, integrated data foundation. Create reporting that answers real questions. Add self-service on a governed base. Then, once that’s working and trusted, extend into forecasting and advanced analytics where the payoff justifies it.
Do it in that order and you end up with BI that people open every day because it genuinely helps them decide. That’s the whole point.
