The world of data visualization is vast and varied. In a business scenario, the importance of visualizing data should be considered. It is not just about having data but how to present it in a way that can drive decisions and strategic planning.
In this article, we will get into one of these data visualization tools, the bubble chart, and why it is highly functional in the business world. Please keep reading to learn more about its role in different business scenarios.
Understanding Bubble Charts and Their Importance
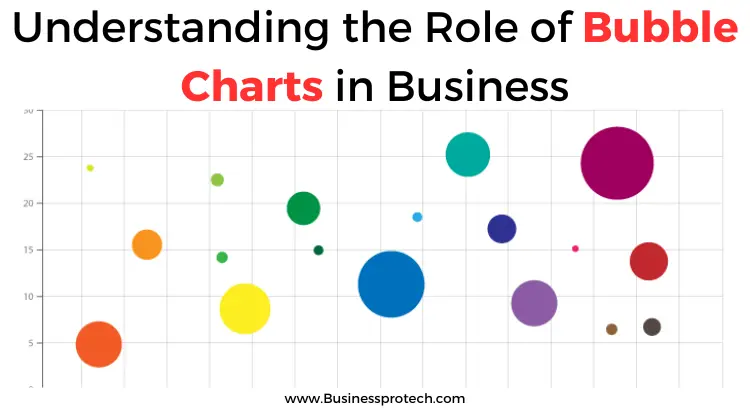
At its core, a bubble chart is a visualization tool representing three data dimensions. Unlike bar graphs and pie charts that only display two-dimensional data, bubble charts include a third metric. This feature gives the charts their distinctive format—circles of different sizes plotted on a Cartesian coordinate system.
As such, bubble charts give us an overview of the trends in the represented data and provide insight into the relationship between data points. If utilized correctly, they can be highly beneficial in analyzing data and displaying patterns and correlations in a clear visual form.
Moreover, bubble charts provide considerable flexibility. You can manipulate their size, color, and location to bring focus to certain data sets or highlight specific aspects. This ability to focus on vital data points makes bubble charts a strategic tool when dealing with complex data sets.

The Basics of Bubble Charts: What They Are and What They Represent
Now that we have understood what a bubble chart is let us dive deeper into its basics. The primary element of a bubble chart is its circles or “bubbles.” Each bubble represents a data point, with its size indicating the value of the third variable. The larger the size of the bow, the larger the value it represents.
The horizontal and vertical axes on the grid represent the first two dimensions of data. Plotting bubbles on this grid allows us to visualize the correlation and magnitude of three variables simultaneously. This is the main strength of bubble charts—their ability to display multiple data dimensions concurrently.
Another critical aspect of bubble charts is their adaptability. They can accommodate any scale and manage disproportional data while maintaining accuracy. This allows businesses to visualize an entire situation at a glance and identify outliers quickly.
Lastly, bubble charts don’t just convey data; they tell a visual story that provides insights that raw data may fail to describe in words. They are beneficial for identifying trends, evaluating the significance of data points, and communicating results clearly and effectively.
The Role of Bubble Charts in Business Analysis

In business data analysis, bubble charts serve as powerful visualization aids. They provide a crucial advantage of quick data interpretation, helping to speed up decision-making. This is paramount since speed can often be the difference between success and failure in many business situations.
Moreover, bubble charts simplify the comprehension of complex, multi-variable data. This can be invaluable for industries that deal with massive amounts of data. It allows stakeholders to quickly grasp trends, correlations, and outliers, enabling them to make informed decisions on strategic moves.
In addition, bubble charts can display relationships between variables that might not be obvious in tables or lists. This capability can help businesses identify overlooked aspects of their operations, hence uncovering potential opportunities.
The ability to highlight critical pieces of data while also showcasing the big picture is why bubble charts are key in business analysis. They provide businesses with the potential to transform their data into actionable insights.